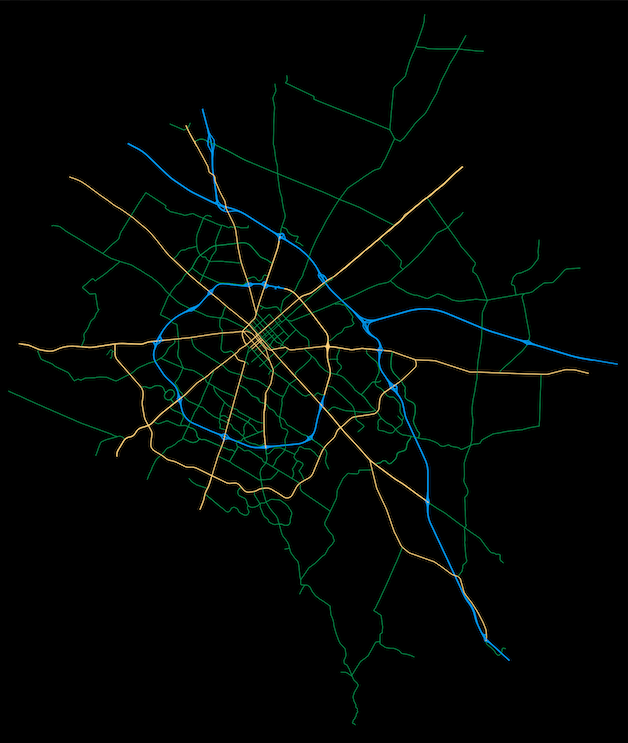
This Github repository demonstrates the usage of OSMnx, a Python package, to download OpenStreetMap data for a specific location and color the road network within that area. It provides functions to assign colors and line widths based on highway types. The code creates a networkx graph from the OSM data, converts it to a GeoDataFrame, and then plots the spatial graph using matplotlib. The resulting plot can be saved as a PNG file. The example focuses on Fayette County, Kentucky, and the resulting plot showcases the road network with different colors and line widths corresponding to the highway types.