Mark Cruse
  • About Me
  • Blog
  • Photography
  • Cartography
    Digital Maps Print Maps
  • Search
Navigation bar avatar
✕

    Interactive Maps

    • Discover the Flavorful World of Central Kentucky Breweries

      Navigate the Bluegrass Brewery Trail with an Interactive Map

      Posted on July 8, 2023

      Post thumbnail
      Post thumbnail
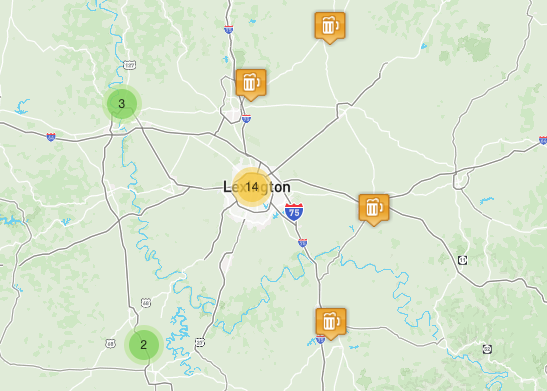
      This interactive map, serves as your gateway to exploring the diverse and thriving Central Kentucky brewery scene. Immerse yourself in the rich flavors and unique offerings of local craft breweries as you embark on a tantalizing journey through the region. The carefully curated map provides valuable information and location details,... [Read More]
      Tags:
      • digital_maps
    • Land Cover - Punta Gorda, FL

      An interactive map with an overlay of land cover data

      Posted on August 1, 2022

      Post thumbnail
      Post thumbnail
      The map presented here represents the final outcome of procedures developed by Mark Cruse for transforming raster data images into vector polygons. You can click on the image below to access the interactive map, while the Python notebook and GitHub repository provide detailed insights into the underlying processes. [Read More]
      Tags:
      • digital_maps
    • Coloring Street Networks with OSMnx

      A Guide

      Posted on May 7, 2020

      Post thumbnail
      Post thumbnail
      If you’re a data enthusiast or GIS professional, you’ve probably heard of OSMnx, the Python package that lets you effortlessly download boundary and street networks from OpenStreetMap (OSM). In this Github repository, we’ll explore how to use OSMnx to acquire OSM data for a specific location and add a splash... [Read More]
      Tags:
      • digital_maps
    • Spatial Patterns in Commute to Workplace

      Using Census Bureau LEHD Origin-Destination Employment Statistics

      Posted on January 15, 2020

      Post thumbnail
      Post thumbnail
      This project aims to uncover fresh perspectives on the communities where we reside and work. In some U.S. cities, there has been a remarkable shift over the past three decades, as they have evolved into both residential and work destinations. This contrasts with predictions made years ago that the rise... [Read More]
      Tags:
      • digital_maps
    • Heritage Trees of Portland

      Exploring the Remarkable Trees that Shape Portland's Natural Heritage

      Posted on October 12, 2018

      Post thumbnail
      Post thumbnail
      Portland, Oregon’s Heritage Trees are a cherished collection acknowledged by the City Council for their exceptional characteristics, such as size, age, historical significance, or horticultural value. Discover these remarkable arboreal wonders through an interactive map that guides you to their precise locations, allowing you to explore the city while immersing... [Read More]
      Tags:
      • digital_maps
    • Great Smoky Mountains Trout Streams

      Trout Species Found in the Great Smoky Mountains National Park

      Posted on October 20, 2017

      Post thumbnail
      Post thumbnail
      Are you curious about the diverse trout species found in the Great Smoky Mountains National Park? This interactive map offers an immersive exploration of the trout streams found in the park. The map showcases an array of trout species and their habitats, offering valuable insights into the park’s unique ecosystem.... [Read More]
      Tags:
      • digital_maps
    • 2016 Adult Uninsured Rates

      Visualizing the Impact: Mapping Adult Uninsured Rates Across U.S. Counties

      Posted on April 10, 2017

      Post thumbnail
      Post thumbnail
      With the implementation of the Affordable Care Act, a significant number of Americans gained access to high-quality and affordable health insurance. This map presents the data illustrating the uninsured rates of non-elderly adults in each county across the United States in 2016. By visualizing this information, the map provides insights... [Read More]
      Tags:
      • digital_maps
    • Tracking the Journey: Exploring Migratory Patterns of Endangered Sea Turtles

      A Comprehensive Map Showcasing Two Decades of Data from State of the World's Sea Turtles

      Posted on March 11, 2017

      Post thumbnail
      Post thumbnail
      By tracking the migratory patterns of endangered sea turtles through satellite technology, marine biologists and conservationists gain valuable insights. This interactive map serves as a platform to highlight numerous publicly accessible geo-referenced datasets. Spanning two decades, the data comprises over 19,000 telemetry points contributed by 13 organizations and individuals, revealing... [Read More]
      Tags:
      • digital_maps
    • U.S. Power Plants: Electricity Output

      Analyzing Regional Energy Output

      Posted on March 9, 2017

      Post thumbnail
      Post thumbnail
      The map visually represents the sizes of power plants based on their total electric capacity output, allowing for easy comparison. To refine the displayed data, users can utilize the fuel filters list located in the top right corner. By clicking on the map, a 500km radius of power plants in... [Read More]
      Tags:
      • digital_maps
    • Discover the Magic of a White Christmas: Explore our Interactive Heatmap

      Posted on December 16, 2016

      Post thumbnail
      Post thumbnail
      Experience the thrill of a white Christmas with our interactive heatmap. Using historical climate data, we reveal the regions in the United States most likely to enjoy snowy landscapes during the holiday season. Discover the enchantment of a winter wonderland as you explore the map by hovering over locations for... [Read More]
      Tags:
      • digital_maps
    • Facebook
    • GitHub
    • Twitter
    • Email me
    • Mastodon

    Mark Cruse  •  2025  •  Edit page